It’s pretty useful to visualise functions visually, especially for multivariable functions.
Multivariable functions
For multivariable functions, see:
When asked to graph a function, it’s a good idea to also graph the traces even if they don’t ask for it. We can graph in MATLAB and in Geogebra.
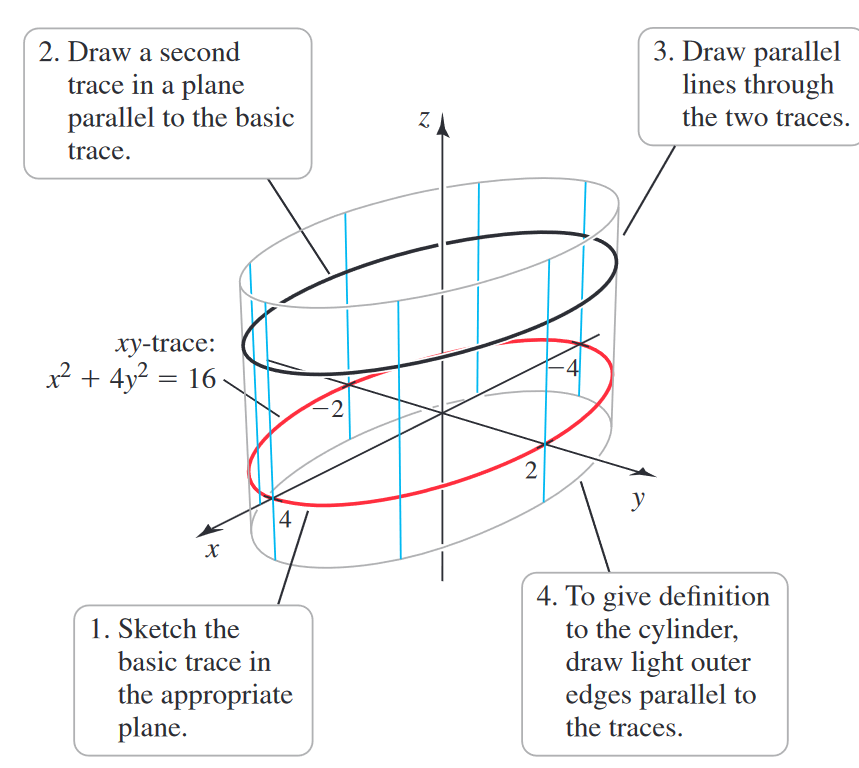
Cylinders
Sometimes we’re given a two-variable relation or function to graph: i.e., an ellipse defined only with and . If isn’t specified, then the ellipse is valid for all .
But if we’re given a domain restriction on , i.e., , then we cap the cylinder.