To plot multivariable functions in MATLAB, a helpful function is surf(z).
The background
surf(z)will plot some 3D function. It takes in a matrix input and cannot accept scalars or vectors.fsurf(z)is substantially more flexible. It can take in functions, plot over a default interval of , and has simpler syntax thansurf.
The doing
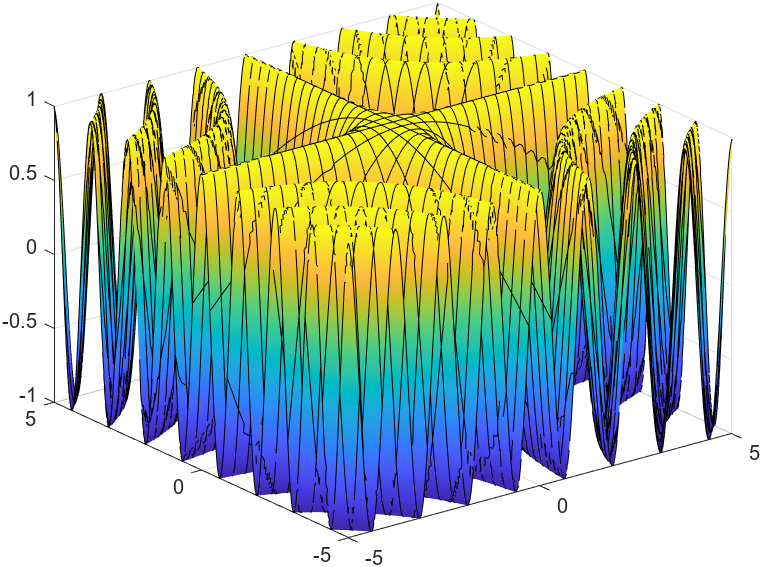
We can use one line for fsurf: fsurf(@(x,y) cos(x .* y).
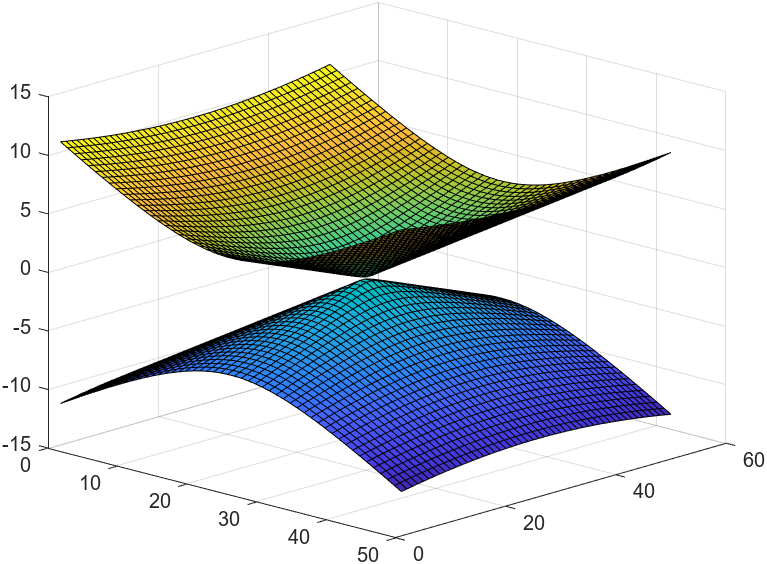
We must generate a vector for our interval of note, then copy it over to another variable with the apostrophe operator. We then set z as our function (note the .^ for non-matrix exponentiation) and use the surf command.
x = linspace(-10, 10, 20);
y = x';
z = y.^2 / 4 + x.^2;
z_min = -1 * z;

surf(z)
hold on
surf(z_min)
hold off