We define the trace as the 2D cross-sectional view of a 3D graph, usually considering the intersection space of a plane with a function. We commonly use the , , and planes.
What does this mean? For an plane and a function in , we set . This usually simplifies it enough for us to understand what we’re graphing.
Let’s use the example . The trace will give us an ellipse. The and traces will give us an upwards parabola with minimum point at .
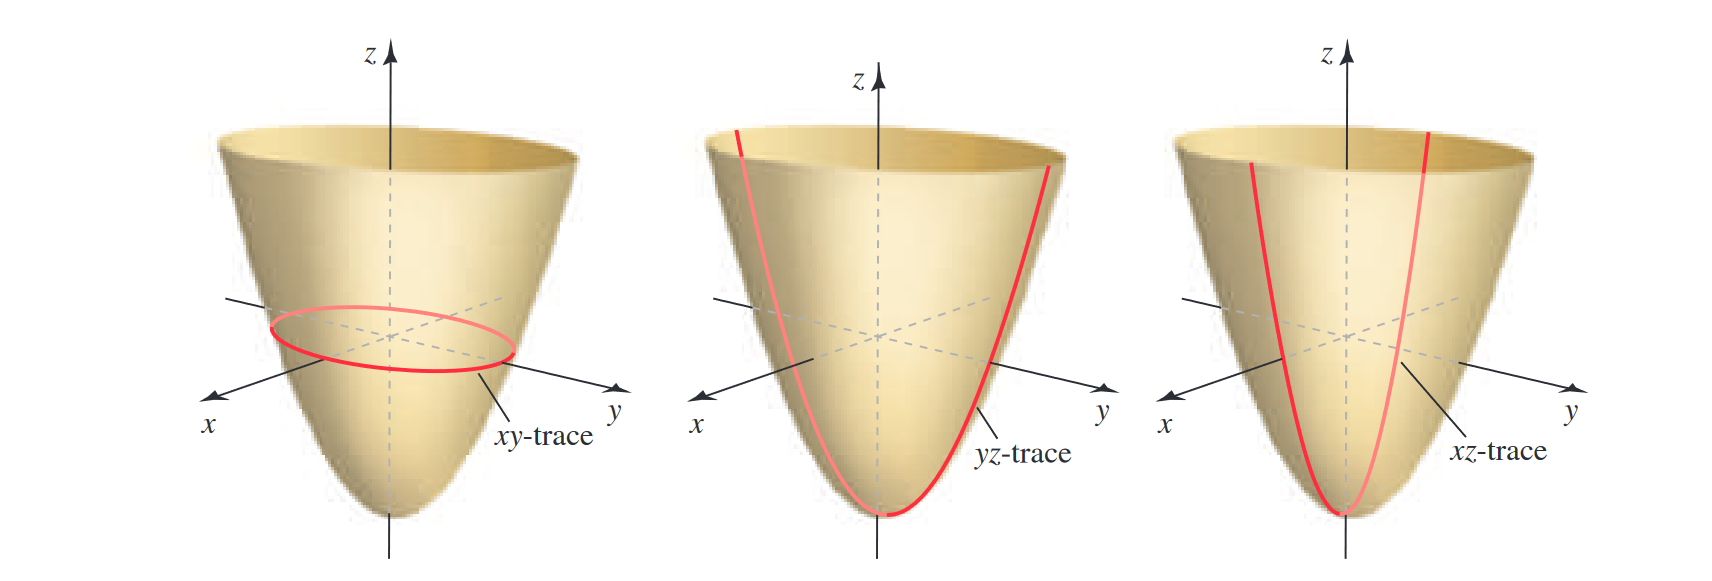 After sketching our traces, we can create a composite sketch of all at once. For example, we would have the three traces above overlaid the axes. Then, we can roughly fill in between. Take note of the domain and range of the functions.