Cash flows for an engineering project occurs when money actually changes hands (we don’t track promises, only actual transactions). For each given alternative, we list down how much money is received and spent each time period during the life of a project. This is done to compare the differences in the alternatives.
Two parameters:
- Costs (negative) are prices or amounts paid (i.e., expenditures) for anything required by the project.
- Benefits (positive) are revenues (not profits!) or cost savings resulting from undertaking the project.
We list a single aggregate value for the end of each time period (since too much detail is unnecessary). The end of the 0th time period is the upfront cost.
Cash flow diagrams
We also frequently represent CFs graphically with cash flow diagrams. Time is on the horizontal axis (where it starts at end of year 0), and cash flows as vertical arrows. The numbers indicate the end of the period.
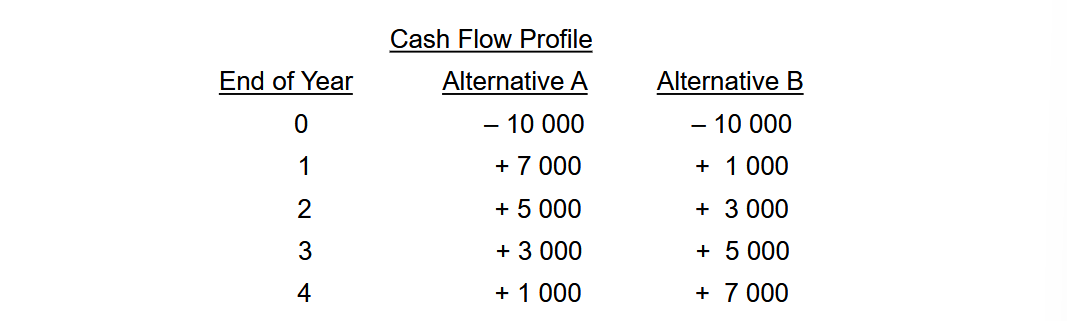
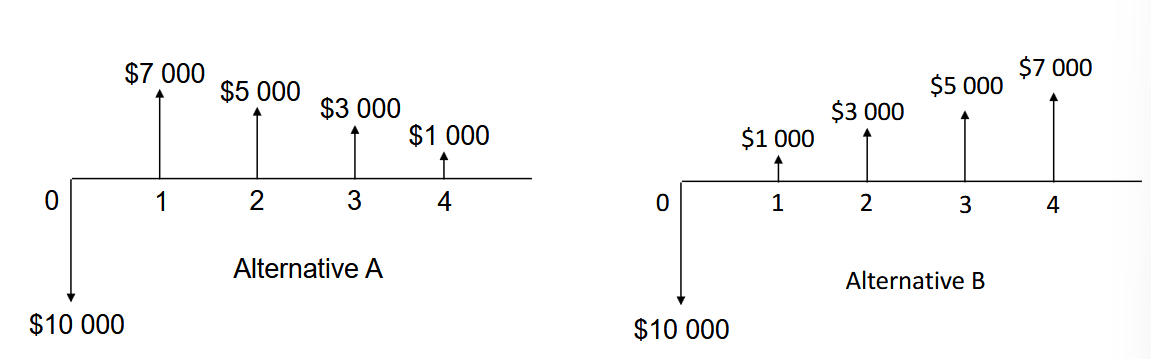 In this example, if we consider the time value of money, alternative A is preferable to alternative B because we get revenue back earlier.
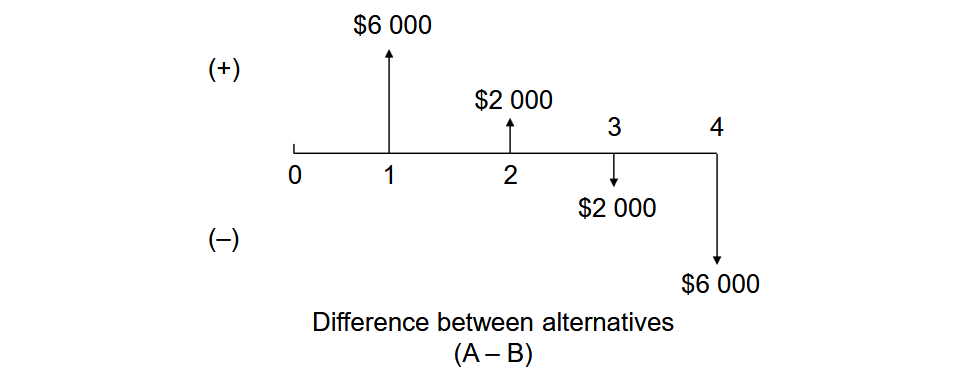
We can also use cash flow to compare different alternatives.
- Positive cash flows are the benefits of choosing alternative A.
- Negative cash flows are things given up when choosing alternative A.