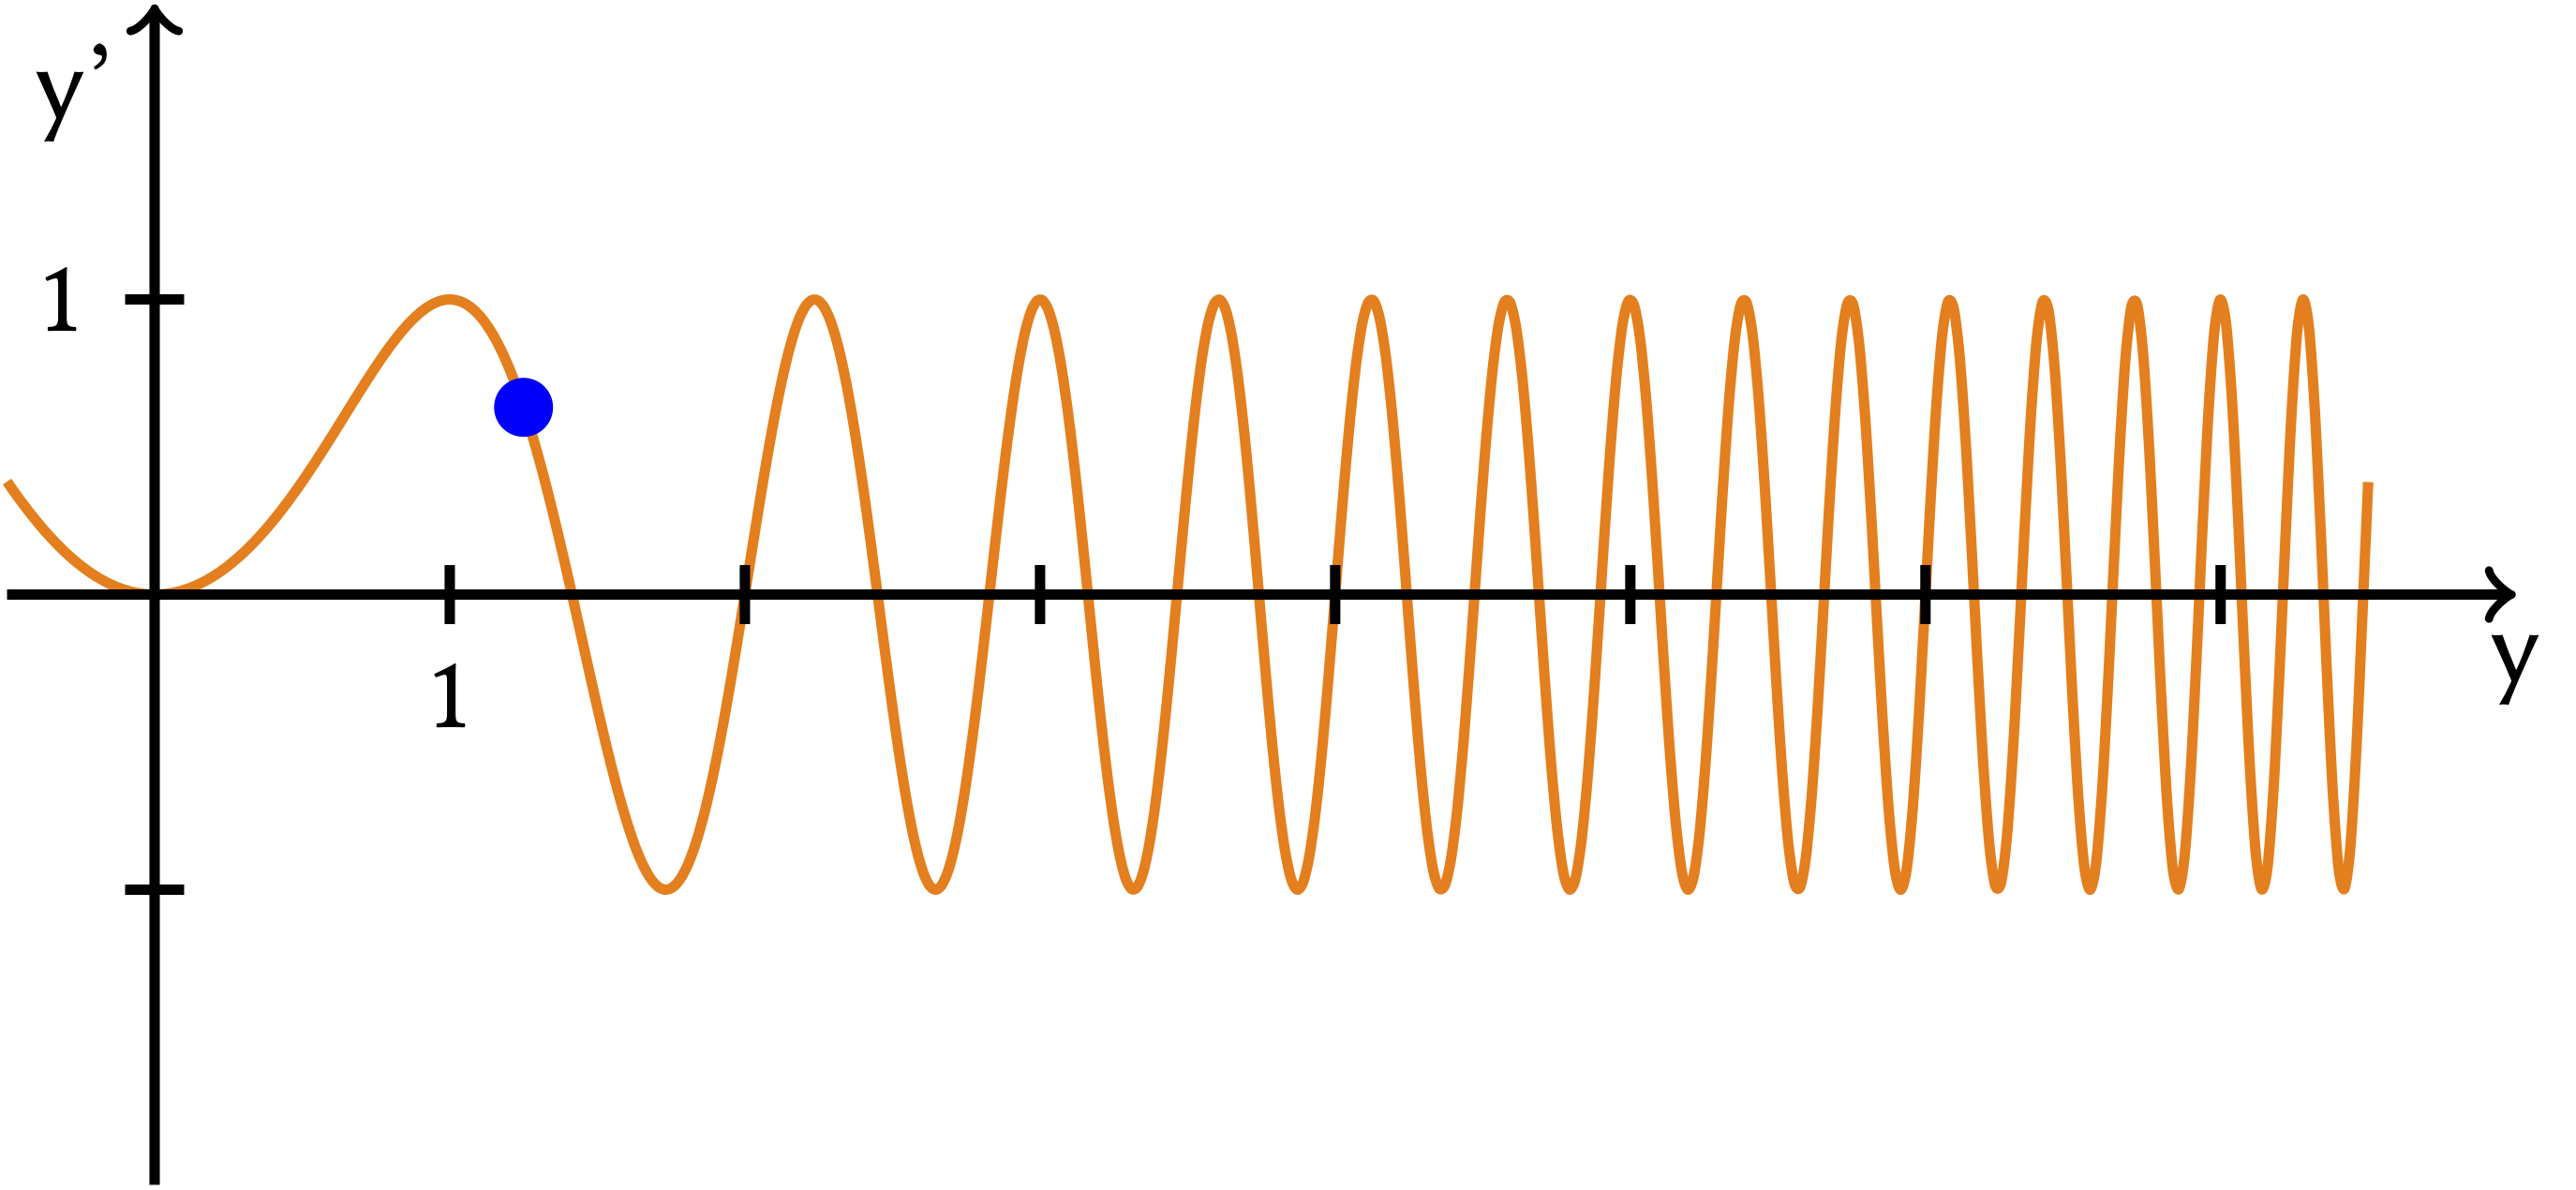
Phase plots help us visualise the behaviour of autonomous ODEs. They graph as the independent variable and as a dependent variable.
A super good way to visualise it is that for , is increasing. For , is decreasing. Points of intersection with the -axis are equilibrium solutions. Drawing arrows on the axis pointing in the direction of the function helps too.
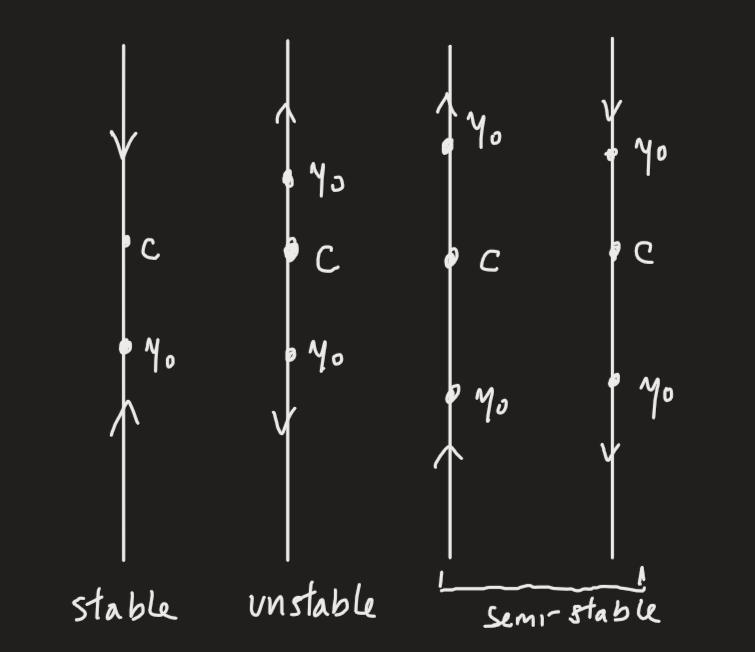
Arrows pointing out on both sides are unstable equilibria, pointing in on both sides are stable, and pointing out/in on one side respectively are semi-stable.
 We can use these to classify critical points of a function. A maxima or minima roughly corresponds to an inflection point (is this true?).
Portraits
A single-dimensional phase plot is called a phase portrait. See the example below:
 We can construct phase portraits by:
- Plotting the critical points on the axis.
- Observing the sign of the ODE between the critical points.