Sankey diagrams are arrow block diagrams representing flows, with the width of the arrow being proportional to the amount being transferred or moving.
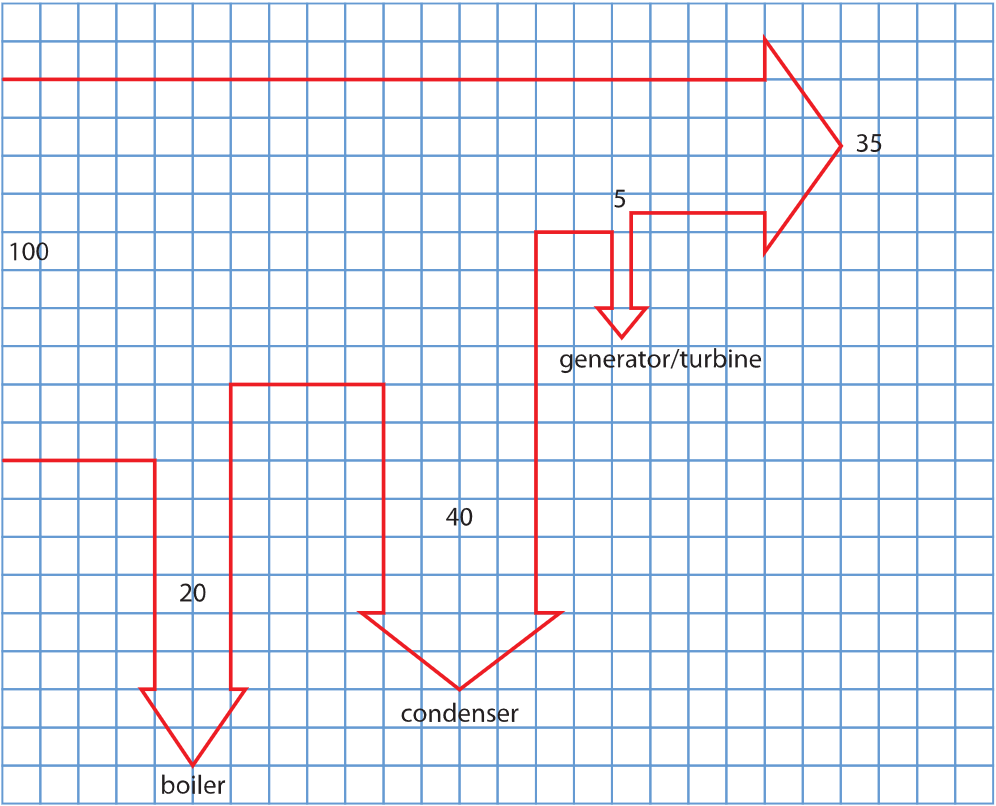
We sometimes use them to represent energy flows in the context of different types of electricity production. For example, the below is a Sankey diagram for a coal-burning power plant.1 100 units of energy go in, 35 units are useful electricity, and the rest is lost at various stages of the process.
 Another application is the use of diagrams to represent the job search process.
Footnotes
-
From Physics for the IB Diploma, by K.A. Tsokos. ↩