A Gantt chart is a histogram-based view of a project showing activities, durations, and milestones, typically showing precedence relationships, people assigned to the work, and percent complete information. We use it in design work for project management.1
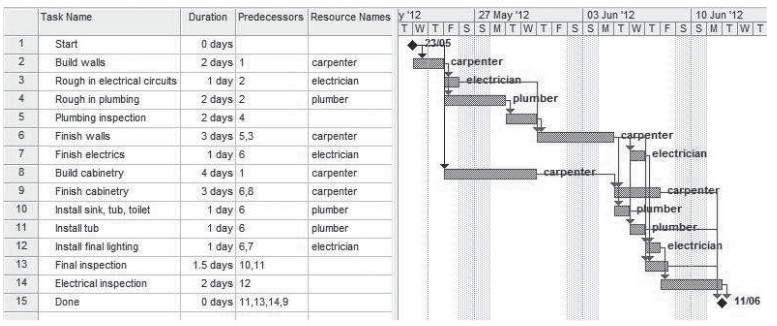 We have a few important definitions:
- Critical path: the longest path.
- Delays to activities will delay the finish date.
- Lead time: overlap time when a task should theoretically wait for its predecessor to finish but can start a little early.
- Lag time: minimum amount of time that must pass between the finish of one activity and the start of its successors.
- Dummy task: dependency with no task.
- Slack time: time a task can be extended before it affects other tasks.
Gantt charts can be made with Microsoft Visio.
Footnotes
-
Example below from Designing Engineers by Susan McCahan et al. ↩