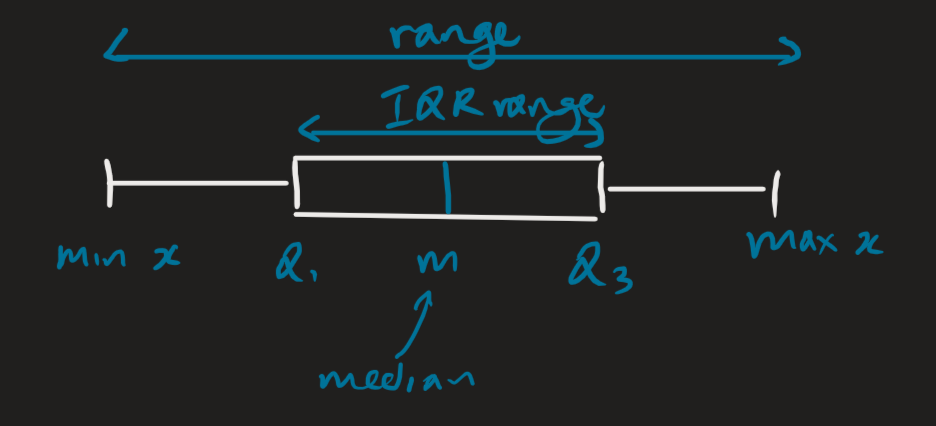
A box-and-whisker diagram (or box plot) gives us a high-level overview of the distribution of a data set. Key features include:
- The minimum and maximum values.
- The first quartile.
- The median (or second quartile).
- The third quartile.
Observe that is referred to as the interquartile range, which is expressed by the range covered by the boxes.